
Population pyramids and Wasserstein barycenters
Introduction
In a past post, I presented a quick overview of the Wasserstein distance1 and how it can be used to compare distributions. I namely discussed some of its main interesting properties such as shape preservation and its ability to capture local correlation, both of which can be extremelly useful for image retrieval and texture mixing.
In this article, I discuss how optimal transport can be used to study age distributions across neighbourhoods and cities. More specifically, I use Wasserstein barycenters2 to identify representative age pyramids and then identify outliers within the city. I wrap up with a brief study of the spatial distributions of these extreme areas.
Motivational example
To illustrate the use of the Wasserstein distance, consider the following example. Using the latest 2016 Canadian census data, one can identify the oldest and youngest 3 dissemination areas (DA)4 (which can be thought of as large neighbourhood blocks) in Quebec City . As the figure below shows, the youngest DA is unsurprisingly located next to the university, while the oldest comprises a large appartment complex for the elderly next to a hospital.
Using these two DAs, we obtain two radically different age distributions. The younger DA has a large proportion of individuals 20 to 24 while the oldest is considerably shifted to the left with a large proportion of individuals in the groups 80 to 84 and 85 to 89. In both cases, we notice an important correlation with neighboring bins. In the young DA for instance, there are sizeable proportions of 15-19 and 25-29 in addition to the 20-24 age groups, which makes intuitive sense. In both cases, we also observe that the shape of distributions is comparable: both are highly skewed and there is some symmetry around the mode.
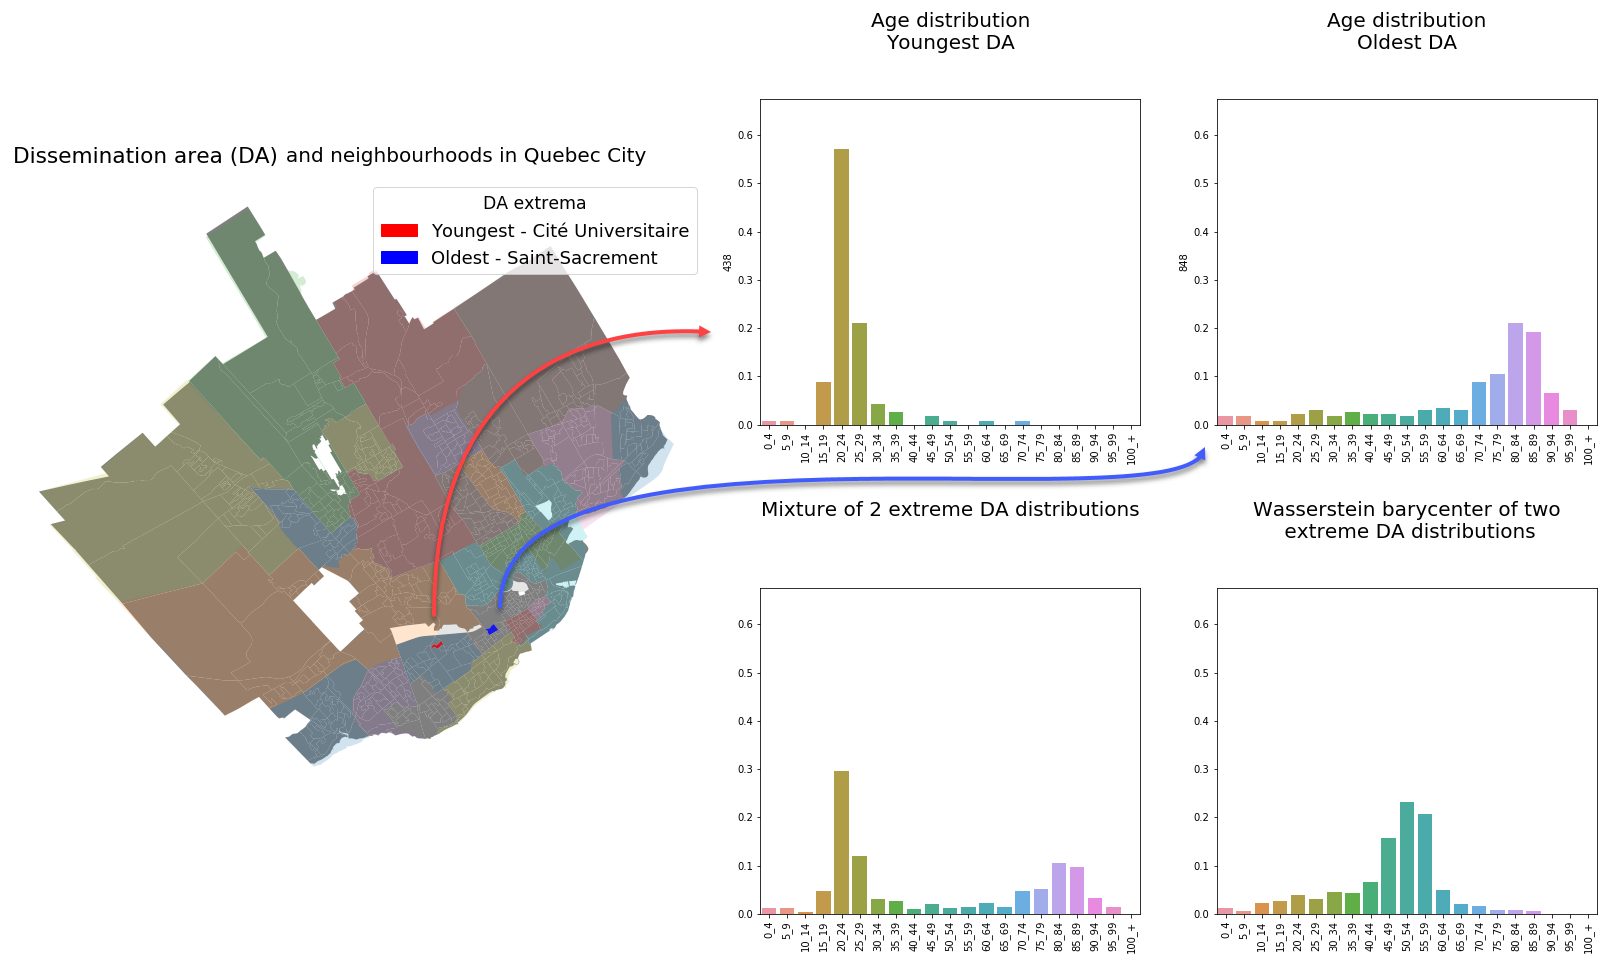
In the map on the left, different colors are used to identify different neighbourhoods and the pale white lines indicate the DA boundaries. The histograms in the bottom row respectively illustrate the Euclidean and Wasserstein barycenters of the two extreme distributions presented in the top row.
A simple way to identify an “average” or representative age distribution from these two histograms might consist of taking the mean of both distributions across each bin. This corresponds to the Euclidean barycenter 5 and leads to a mixture whose distribution is given in the lower left plot. As expected, the new distribution is bi-modal, which does not reflect the shape of either young or old age pyramids.
On the other hand, computing the Wasserstein barycenter results in an arguably more representative distribution. As can be seen in the lower right plot, the shape of both distributions is better preserved. We adequately represent the average age of both DAs while simultaneously repecting the observation that dissemination areas will likely contain people of similar age.
City-wide barycenters
Taking the barycenter with Euclidean and Wasserstein distances over all dissemination areas forming the cities of Quebec City and Montreal, yields the following figures:
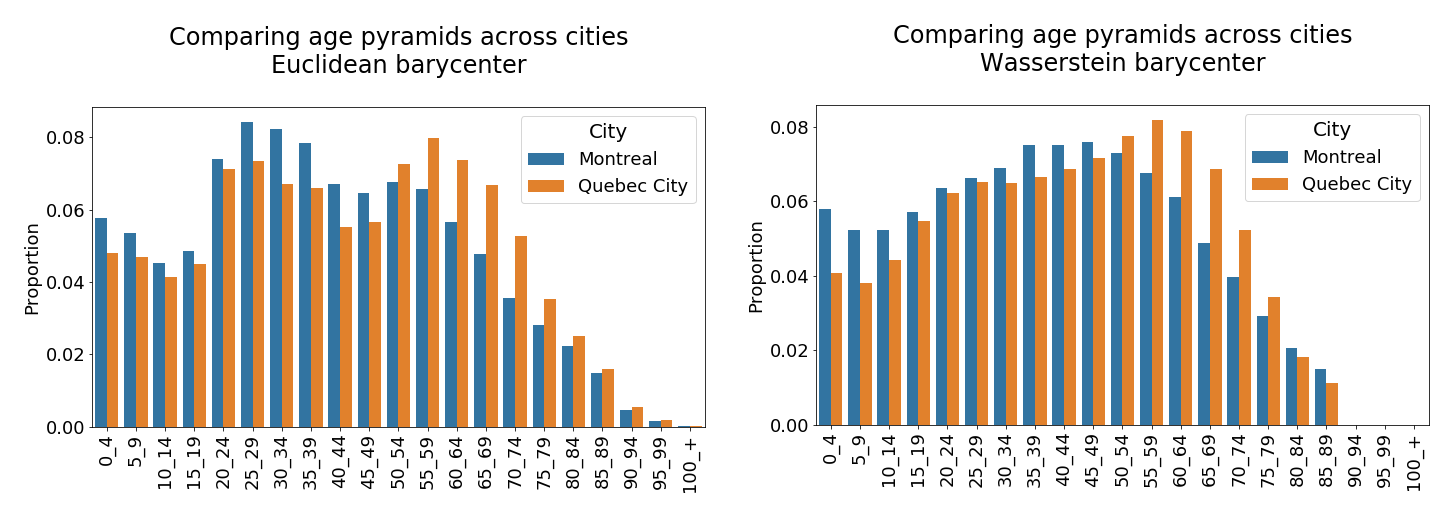
Age distribution comparisons - Montreal vs Quebec City
Like in the opening example, we notice that the Wasserstein barycenter enjoys better shape preservation than its Euclidean counterpart. Indeed, the Wasserstein barycenter is more uniform and does not have the 2 large spikes that the Euclidean barycenter has for age groups 25-29 and 50-55 in the case of both cities. This makes intuitive sense since these age groups are unlikely to be living close to one another. The Euclidean barycenter is therefore a poor representative of any single dissemination area.
As a side note, both figures suggest that Quebec City is older than Montreal. Both barycenters are shifted to the right in the case of Quebec and the mode of the Wasserstein barycenter is 55-59 while it is only 45-49 for Montreal.
Intra-city comparisons
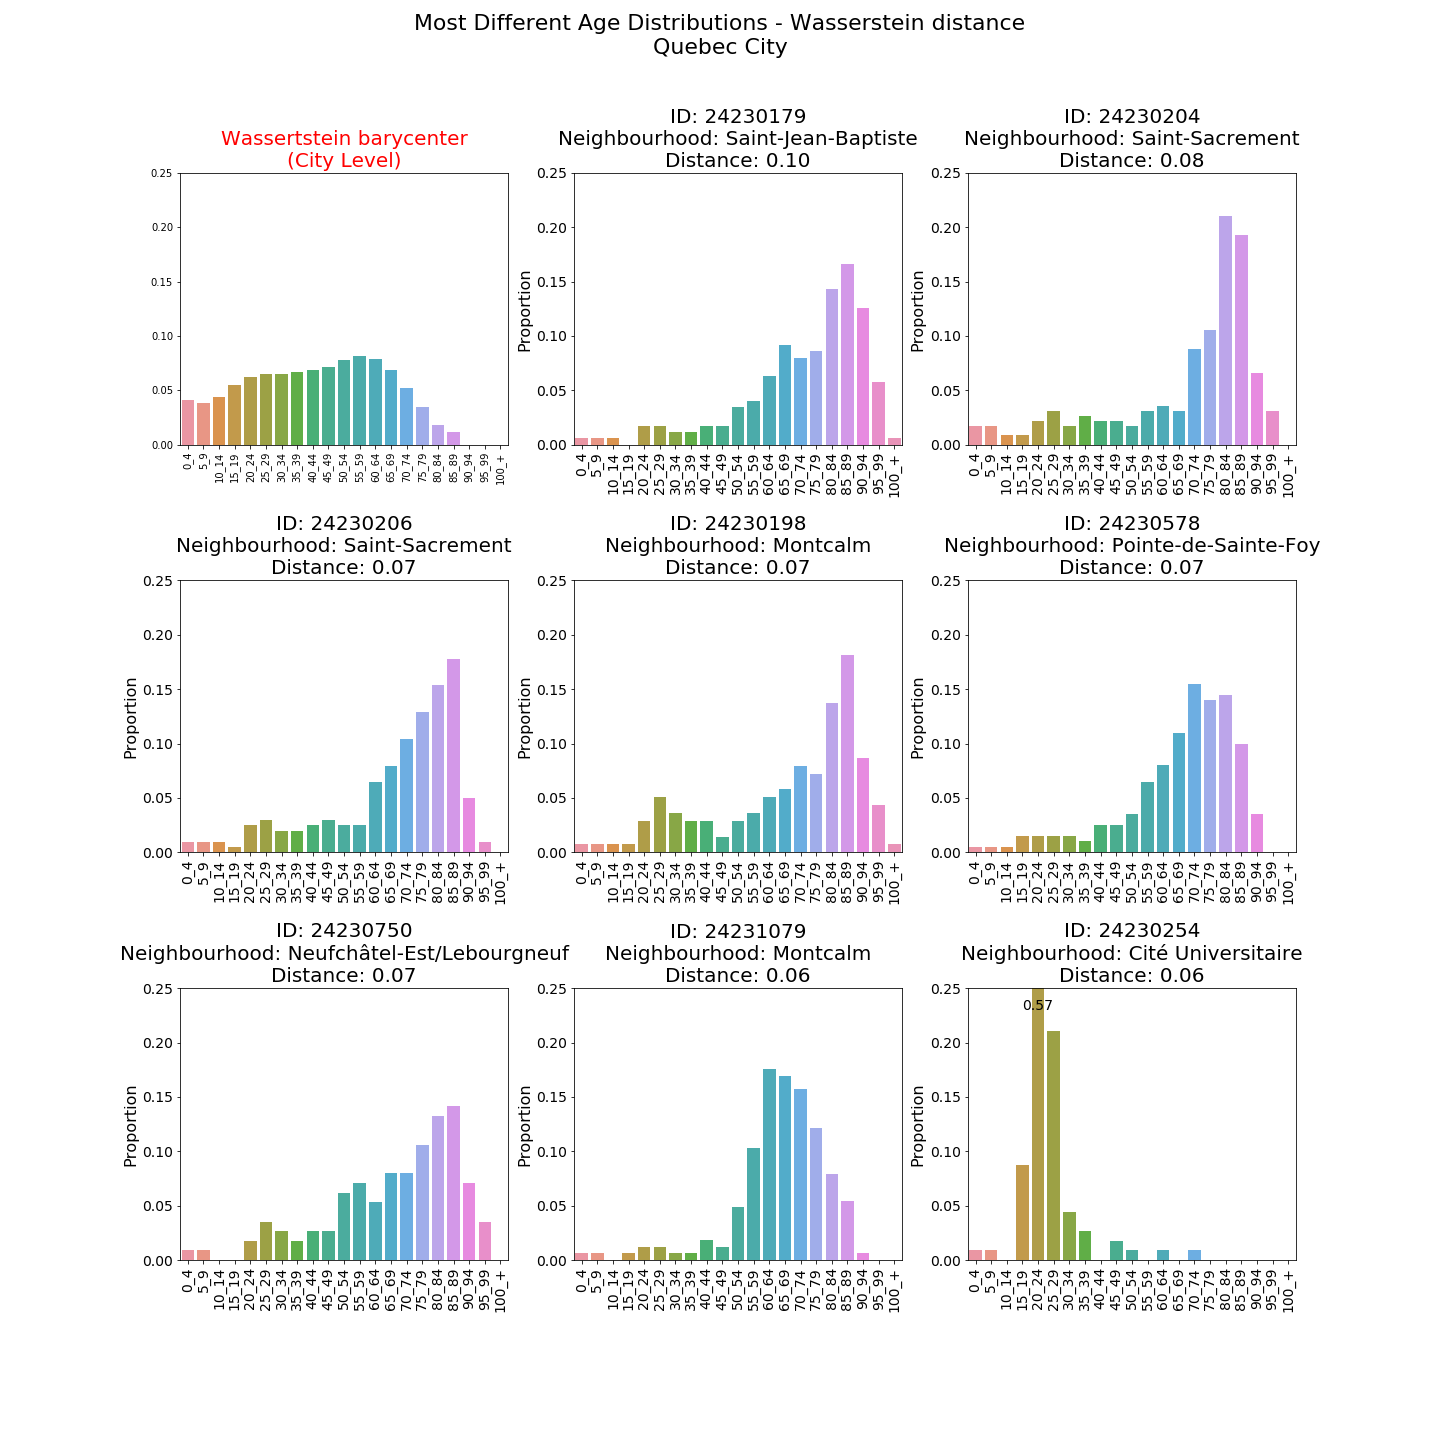
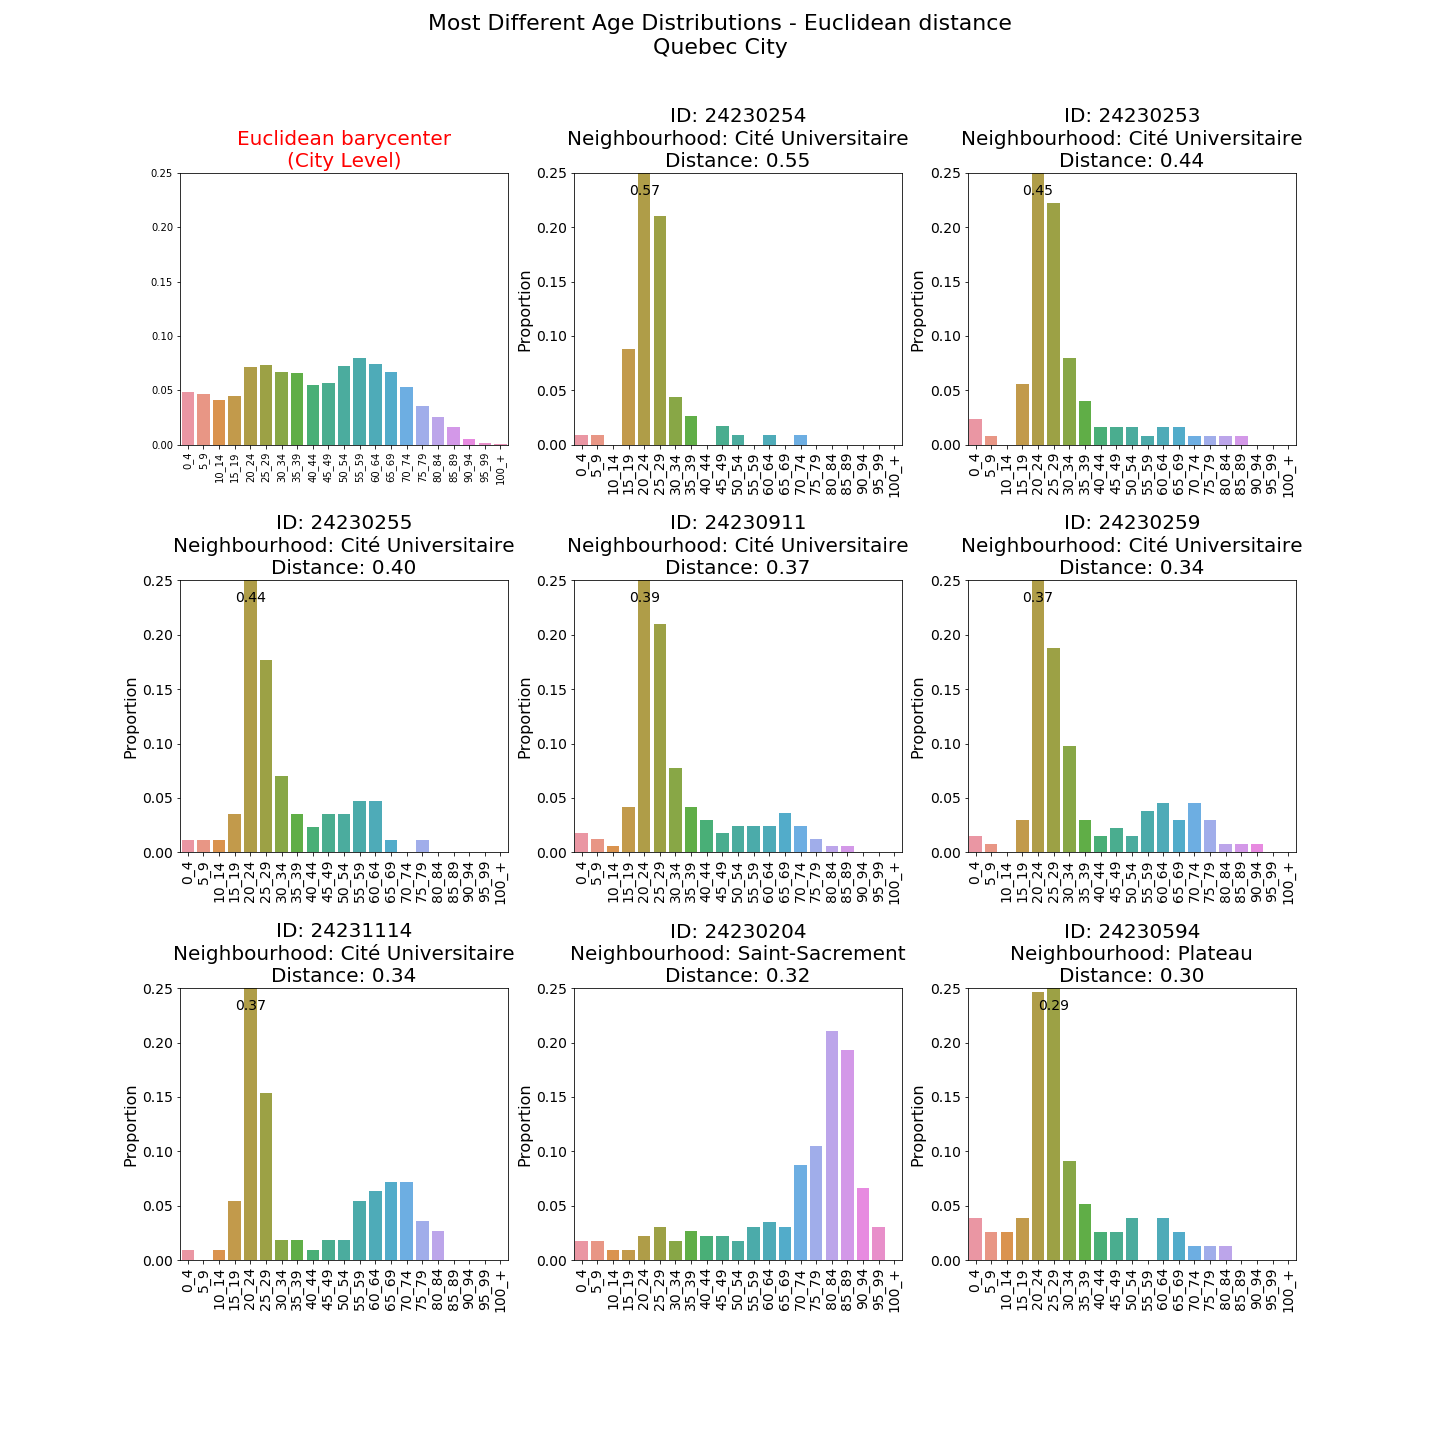
Computing the distance from each dissemination area’s age distribution to the city-wide barycenter also reveals interesting patterns. Examining the 8 largest outliers (those with the largest distance from the barycenter) using the two distances shows that the Wasserstein distance generally allows identification of older DAs while the Euclidean distance picks up on DAs that are younger.
Quebec City
In the case of Quebec City, the difference in outlier detection across distances can clearly be seen in the following two figures. All but one outlier are old DAs in the case of the Wasserstein distance:
On the other hand, the Euclidean distance identifies DAs where a very large share of the population is formed by the 20-24 and 25-29 age groups alone.
Montreal
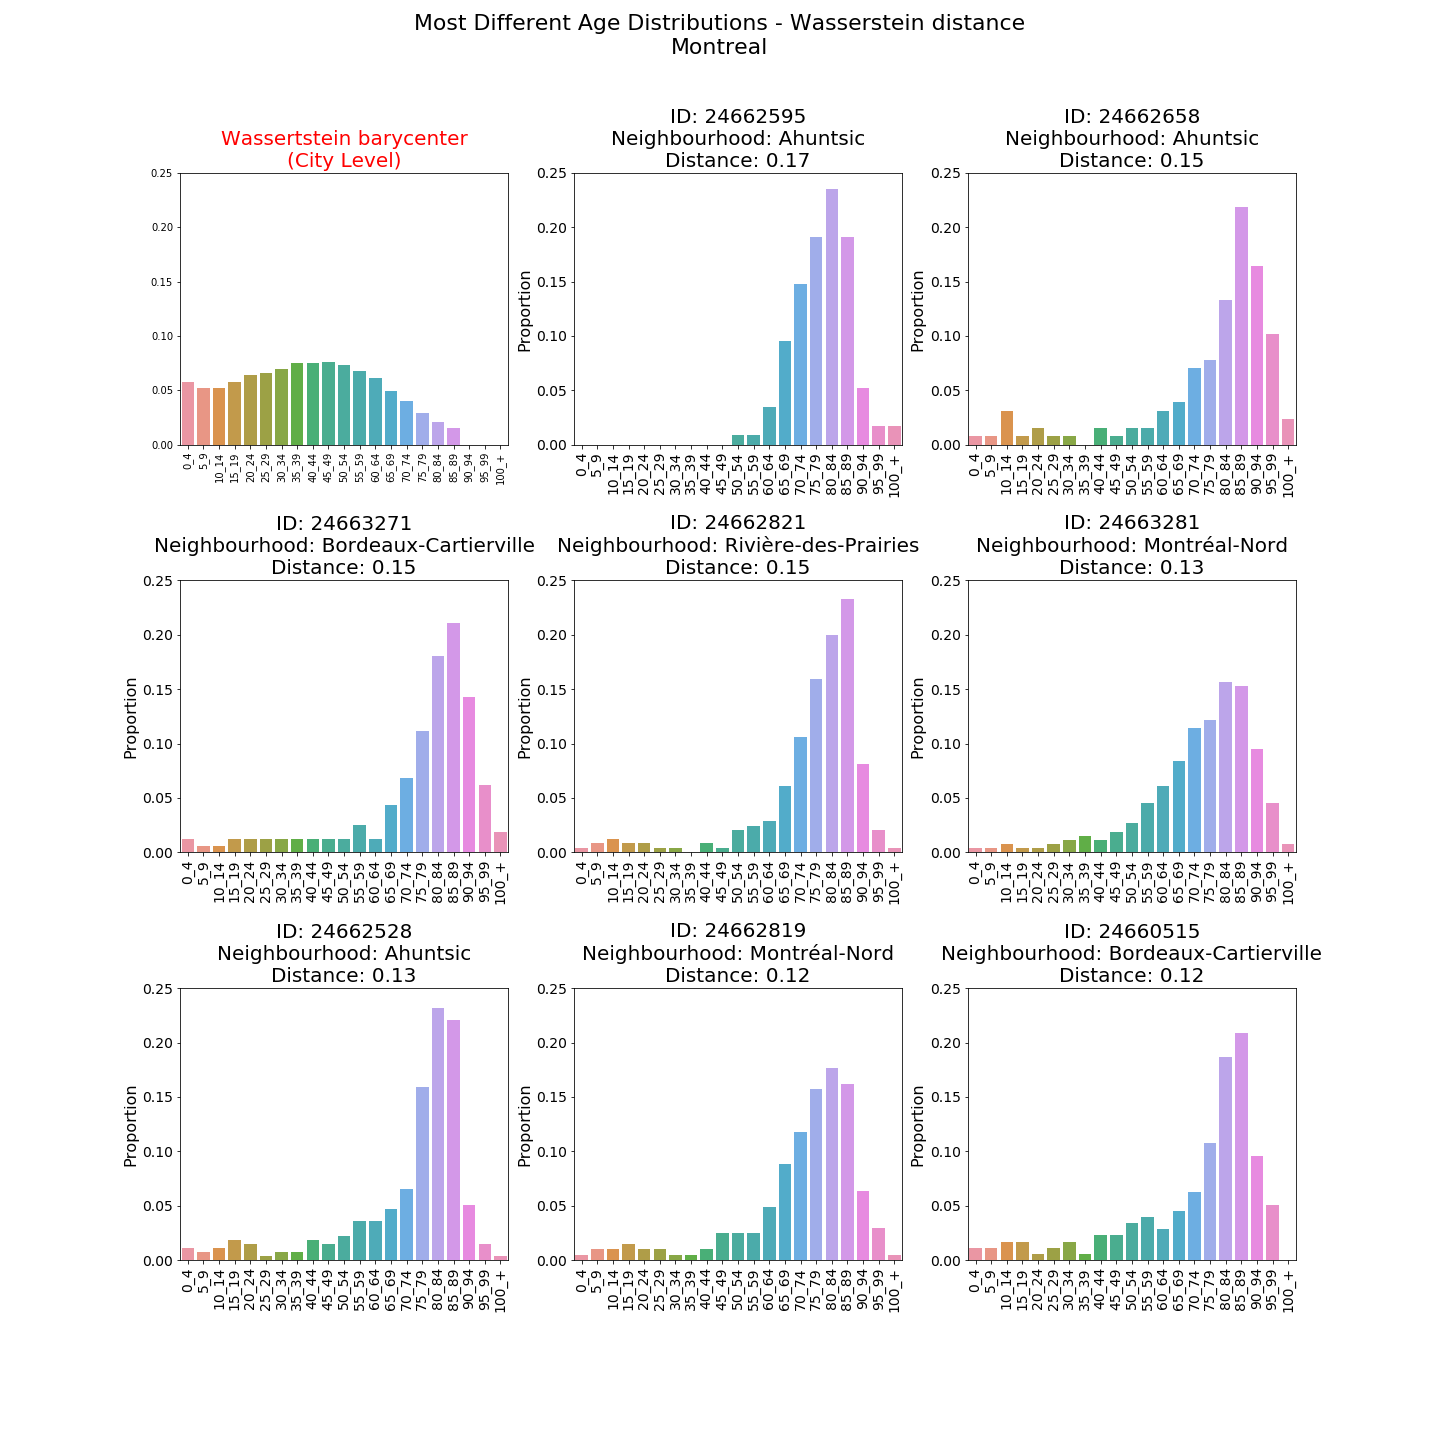
The same pattern is somewhat repeated for Montreal. All Wasserstein outliers have a large proportion of elderly.
The Euclidean distance picks up on DAs with a high proportion of youth. However, unlike Quebec City, it also identifies older areas.
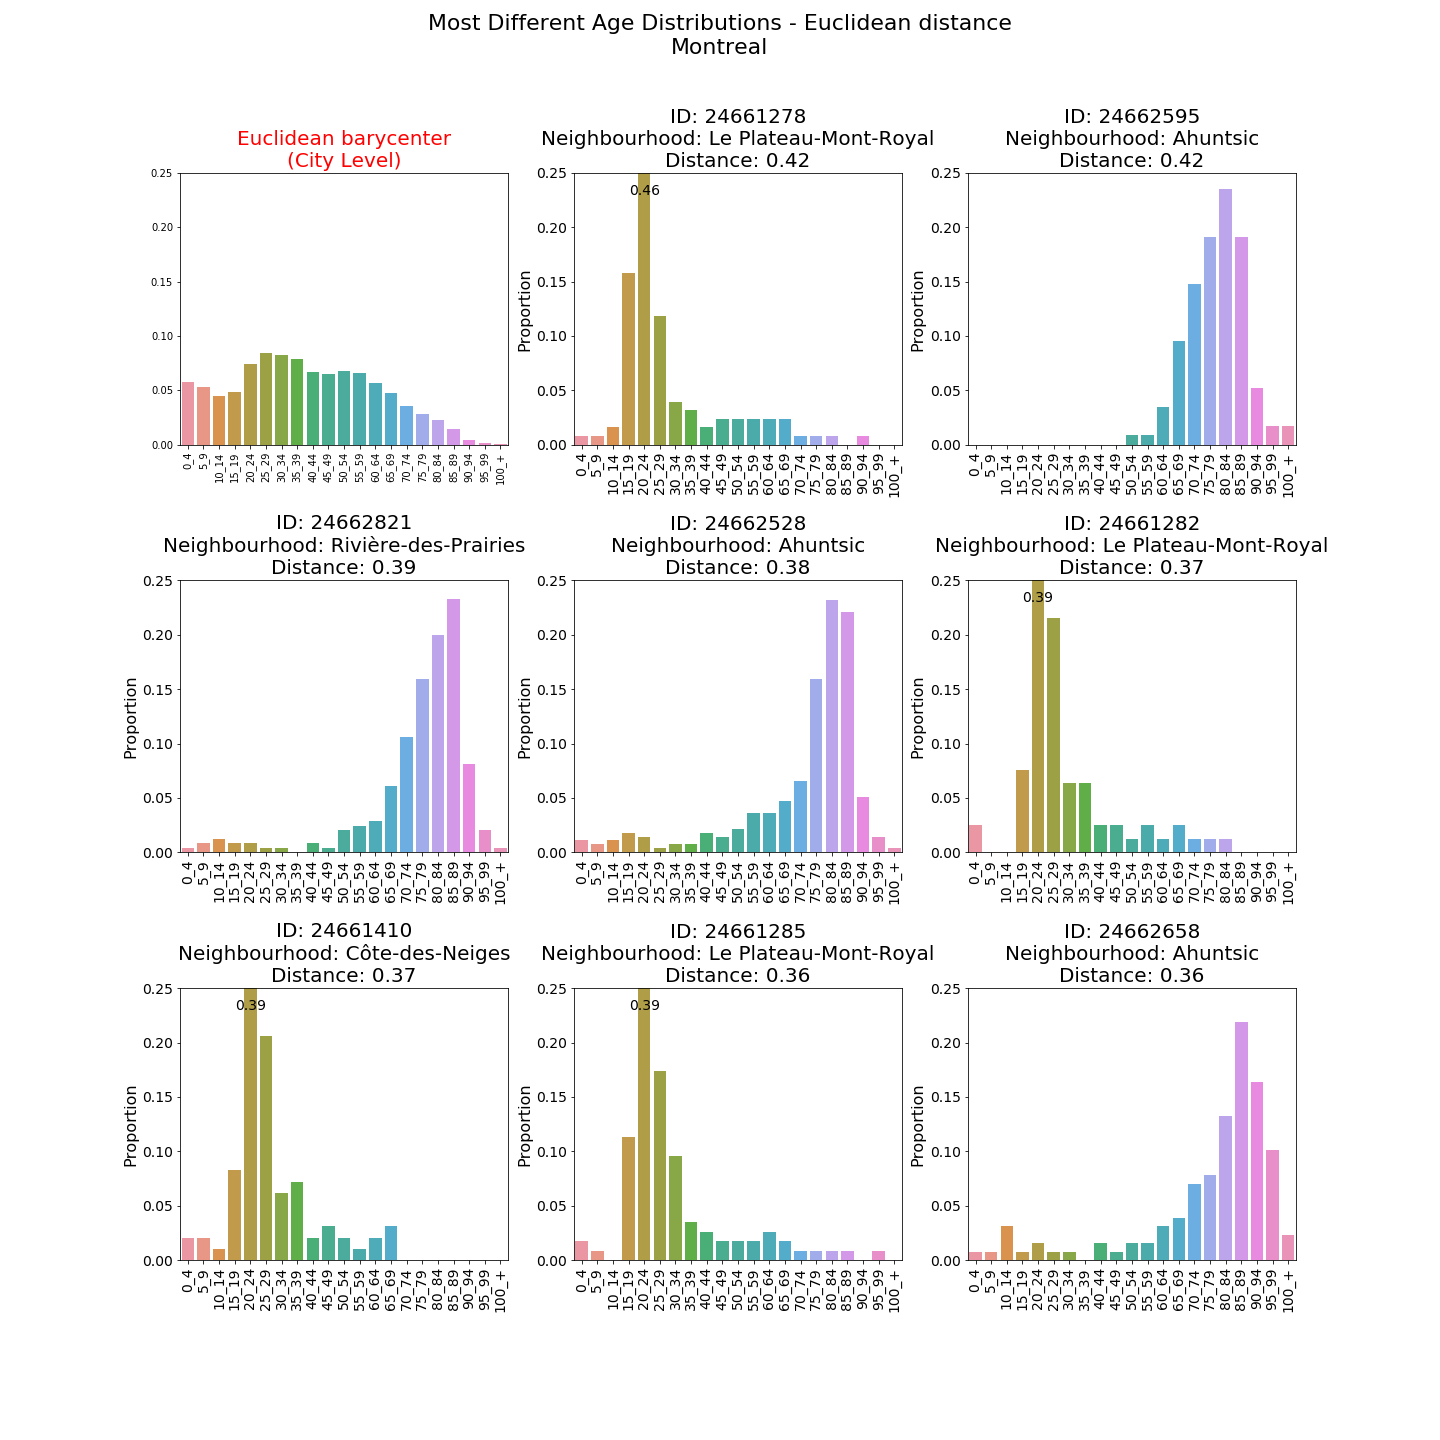
This difference in outlier detection is chiefly due to the bin-by-bin comparison of the Euclidean distance as well as the fact that \(||u||_2^2=\sum_i u_i^2\) places large weight on bins that have a large difference with the barycenter. It turns out that the DAs with a single large deviation (relative to the barycenter) are often areas near universities with a very high proportion of individuals in the single age group 20-24.
On the other hand, the Wasserstein distance can identify groups of bins that have a very different proportion relative to the city-wide barycenter. It turns out that this is often the case of old DAs that have a high proportion of 75 and up, but not necessarily a large proportion of any single age group 75-79, 80-84, 85-89, etc.
Spatial distribution of outliers
Mapping the results highlights interesting spatial patterns within a given city. As mentionned previously, many of the most extreme (in terms of the Euclidean distance) DAs in Quebec City and Montreal are located next to universities since they are attract many young adults aged 20-24. The following map reveals that for Quebec City, many of these DAs are located surprisingly close to other DAs that have a high proportion of elderly.
Even with the Wasserstein distance, one of the very young DAs (8th most dissimilar) is not very far from one of the very old ones (9th most dissimilar), both of which are located within the Cité-Universitaire neighbourhood.
This large spatial variability seems less marked for Montreal. We see that older DAs tend to cluster around the Rivière des Prairies, whose shores have various complex lauding the tranquility of the area and adapted for the elderly. Unsurprisingly, the young outliers are found in the McGill ghetto at the Peter McGill/Plateau boundary as well as near UdM in Côtes-des-Neiges.
It is also interesting to note that for both distances, the old DAs in Montreal generally seem located further from downtown than the younger ones. This makes intuitive sense as more dynamic and lively neighbourhoods have a natural tendency to attract younger populations. The high concentration of elderly in central neighbourhoods of Quebec City like Montcalm, Saint-Sacrement and Saint-Jean-Baptiste is peculiar.
Conclusion
This post illustrates some of the interesting properties of the Wasserstein distance and its resulting barycenter. When comparing distributions, we see that this distance can be used to identify outliers with very different properties than those found using the more classical Euclidean distance. In the case of age distributions, we namely see that the Euclidean distance has a tendency to identify single bins with large values while the Wasserstein distance can help identify unusual groups of neighboring bins.
Consider the case of two discrete distributions \(\{(x_i, a_i)\}_{i=1}^{n}\) and \(\{(y_j, b_j)\}_{j=1}^{m}\) where \(x_i , y_j \in \mathbb{R}^d\) represent atoms and \(a_i, b_j \geq 0\) are probabilities where \(\sum_i a_i = \sum_j b_j = 1\). We also let the distance \(D(x_i,y_j) \geq 0\) represent the cost of moving 1 unit of mass from \(x_i\) to \(y_j\). The Wasserstein distance can then be computed by solving the following linear program: \(W_p^p(a,b) = \min_{\Pi} \sum_i \sum_j \Pi_{ij} D_{ij} : \; 1^{\top}\Pi = b, \; \Pi 1 = a\) where we optimize over the non-negative matrix \(\Pi\) where \(D=\{ D(x_i,x_j)^p \}_{ij}\).↩
Recall that given \(N\) discrete measures \(\{\sum_{i=1}^n \delta_{x_i} b_i^k\}_{k=1}^N\) with fixed finite support \(X=(x_1,\cdots,x_n)\), the Wasserstein barycenter is defined as the discrete measure \(\sum_{i=1}^n \delta_{x_i} a_i\) solving \(\min_{a \in \Delta} \sum_{k=1}^N \frac{1}{N} W_p^p(a,b_k)\).↩
I define the youngest dissemination area as the one with the largest share of individuals aged 0-14 and the oldest as the one with the largest share of individuals 80 and older.↩
The dissemination area is the finest level of granularity at which the Canadian Census provides data on age distributions. Throughout the post, we consider the same 5 year discretization used by Statistics Canada.↩
Given \(z_i \in \mathbb{R}^d, i=1,\cdots,N\), the Euclidean barycenter is defined as \(m^* \in \arg\min_u \sum_{i=1}^N \frac{1}{N}||z_1 -u ||_2\) which is simply \(m^* = \sum_{i=1}^N \frac{1}{N} z_i \in \mathbb{R}^d\).↩
