
Urban green spaces
Introduction
Amidst the recent COVID-19 pandemic, there have been talks of reevaluating urban planning and density. To help urban citizens cope with the lockdown and the impossibility to travel to the countryside, many have pushed for more parks and vegetation. Some even argue that parks are the only remaining havens in densely populated cities where not all dwellings have porches and balconies.
This post explores the green spaces in Montreal and Quebec City. It tackles questions like:
- Is one city greener than the other?
- Which has more parks?
- What parts of cities enjoy the most vegetation?
- How can we increase vegetation in dense urban areas?
Canopy
To get a good idea of the presence of vegetation in each sector, we first consider the area of the canopy and compare this with the total neighbourhood area. 12

Proportion of neighbourhood covered by tree - Montreal
Unsurprisingly, the sparser and larger Quebec City has considerably more trees than Montreal. Three neighbourhoods have a whopping canopy index of 75% or more. The greenest Montreal neighbourhoods, Peter-McGill and West-Island, do not come close. Even if the former is occupied in large part by the Mont-Royal park and the latter is a suburb, they are only covered by 38% and 39% of trees.

Proportion of neighbourhood covered by tree - Quebec city
However, there is considerably more variation in the canopy index for Quebec City. While neighbourhoods like Val-Belair are essentially woodland with few residential developments around the highway, many of the older, poorer and denser central neighbourhoods like Saint-Jean-Baptiste and Saint-Roch have a canopy that is comparable to many urban Montreal neighbourhoods. Recent initiatives aim at improving the situation, but these will take time.
Parks
The canopy index is probably one of the most reliable measures to consider when evaluating the greenness and vegetation of a city 3. However, it is also interesting to evaluate the presence of public parks. This analysis is even more appropriate since many public parks were built to provide fresh air in order to improve the health of city dwellers in time of pandemics. Although these initiative were driven by dubious medical findings, parks unarguably play an essenial role in improving the quality of life in the city.
Perhaps surprisingly, the following two maps reveal that there are actually more parks in Montreal covering a larger area than in Quebec City:

Park map - Montreal

Park map - Quebec City
Of course, the neighbourhoods at the edge of Quebec City are densely vegetated and unpopulated. Focusing on the urban core of the city reveals a similar picture to that of Montreal as a whole.

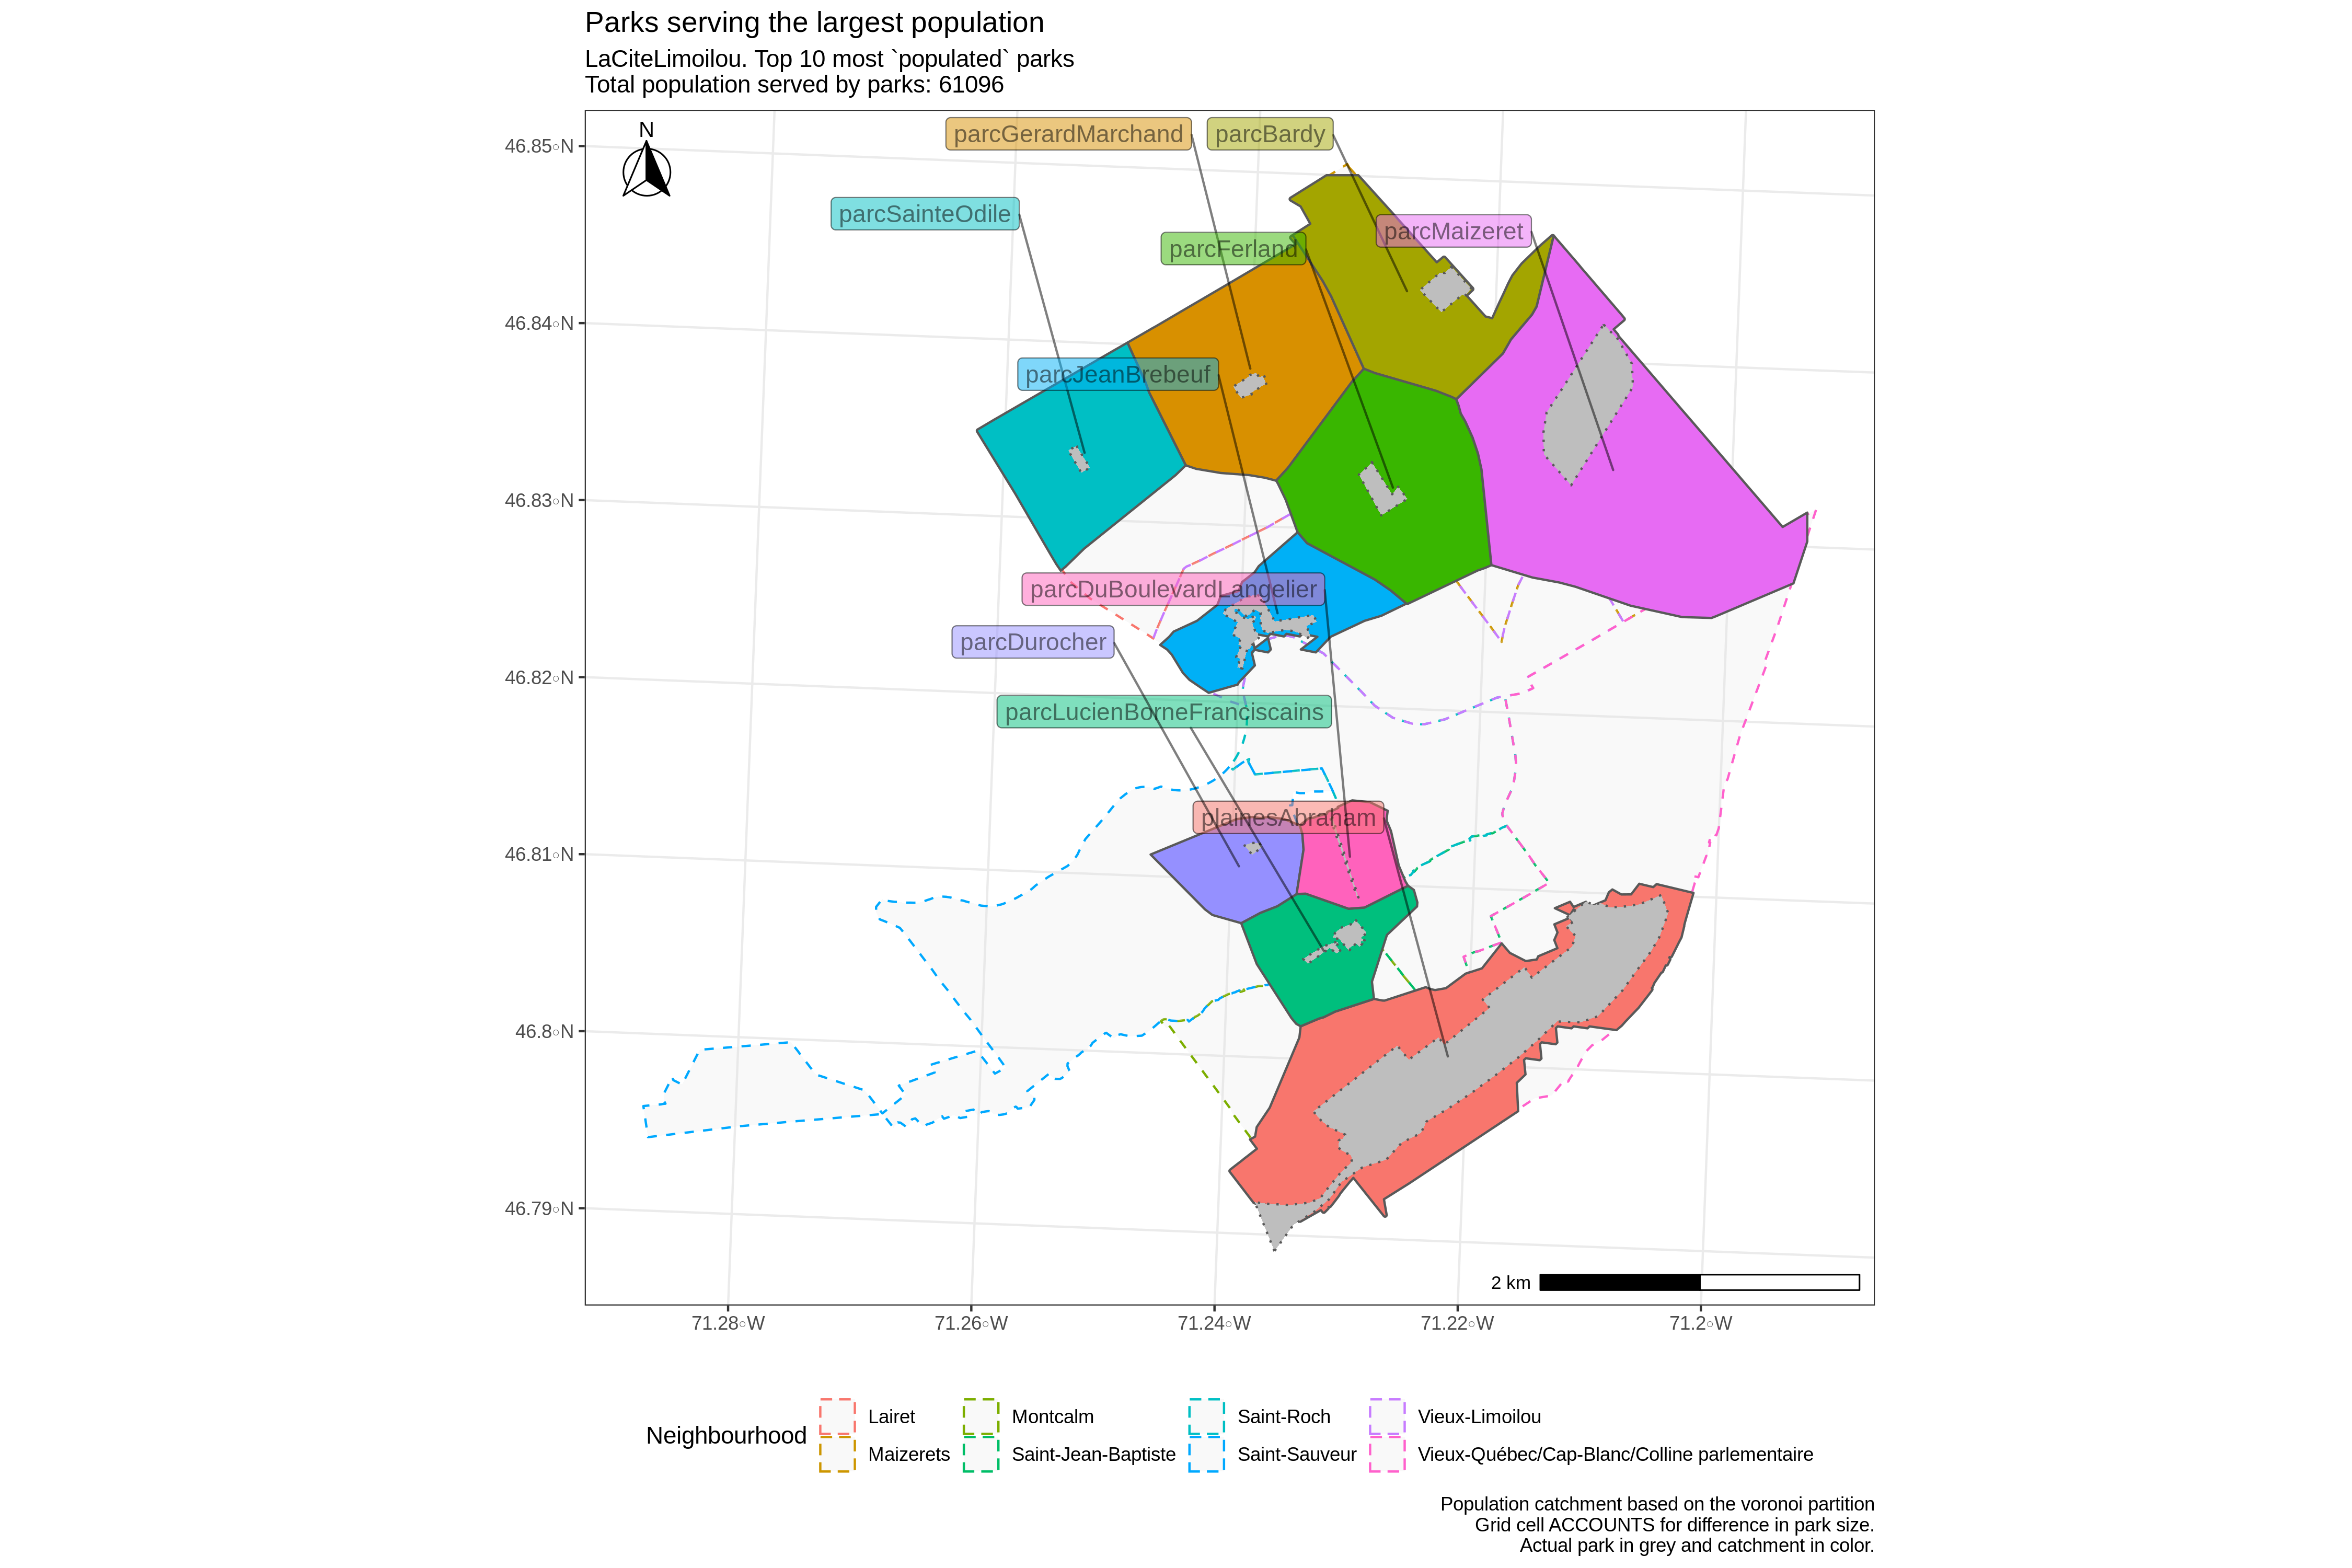
Park map - La Cite-Limoilou borough, Quebec City
The attentive reader will note the presence of many linear parks, which often follow river banks or old railways and represent a highly efficient use of space and land repurposing. Quebec City has the corridor des cheminots, corridor du littoral, park de la rivière Saint-Charles 4 and park de la rivière Beauport while Montreal has parks like ile de la visitation, réseau vert, park historique du canal Lachine to name only a few.
Park size
The following bar charts illustrate that parks are also much larger in Montreal than Quebec.

Park size and neighbourhoods - Montreal

Park size and neighbourhoods - Quebec City
The three largest Quebec parks: base de plein air Sainte-Foy (873462)5, parc Chauveau (960419) and the plaines d’Abraham (837375) are all under 100 hectares while Montreal has over 8 parcs larger than that value. Although the three largest Montreal parks are in the suburbs at the extremity of the island, some of these, most notably the Mont-Royal park, are located next to densely populated sectors.
Park catchments
It is also interesting to evaluate the bassin of population “served” by the parks, which is arguably more important than raw size since it indicates how many citizens might enjoy the area. In order to compute these catchments, we consider the voronoi partition formed by the parks (see the technical section below for more details). For each park, the associated voronoi cell represents the points that are ‘attracted/assigned’ to that park 6.
We then get an estimate of the population within these cells using simple area weighted interpolation after merging with Statistics Canada dissemination area data. The voronoi cells with the largest population are those associated with the largest parks located in densely populated regions with few competing parks nearby.7:
For any point in a given voronoi cell, the associated park is closer than any other. Even if city dwellers do not always visit the same nearest park, proximity remains vital in central areas where people are presumably walking or biking. This partition therefore best indicates the neighbourhood parks that might be visited on a casual weekday for instance.
Computing buffers of fixed size around parks could also provide interesting information since areas with multiple overlapping polygons represent zones that have access to many parks close by. However this would no longer partition the entire population.
The following two maps show that the most populated park catchments in Montreal are smaller, spread out over a larger region and more densely populated than those in Quebec City. The two largest parks in Côte-des-Neiges have an assigned population of over 12 000 people and cover only 105 and 93 ha while the largest catchment in Quebec (plaines d’Abraham) serves around 9 000 people and has a size of 125 ha. This illustrates the difference in population density patterns across both cities. 8

Park catchments - Montreal
Park catchments - Quebec City
The preceding maps also show that even if a park is extremelly narrow, it can still give many citizens access to vegetation. This is the case of the réseau vert (a park next to train tracks) in Montreal and the Boulevard Langelier park (vegetated road divider) in Quebec City 9.
Conclusion
This post highlights the importance of green spaces and public parks for cities. They provide leisure and vegetation for citizens, reduce heat and protect natural lands. These benefits are essential, particularly in densely populated urban parts of cities. As the various linear parks exemplify, urban parks do not necessarily need to occupy vast amount of expensive and rare space. Land around old train tracks or waterways can be efficiently exploited.
Although the COVID-19 pandemic brings a host of negative consequences, perhaps it will also give us the chance to reevaluate and appreciate the urban parks we have and develop additional green spaces.
Technical comment on park catchments
A naive approach to compute the voronoi partition of a set of polygons (for instance parks) is to consider the centroid of each shape and then compute the voronoi partition from this set of disjoint points. However, this disregards size of parks and may even bias the population catchment downward for large parks since the centroid is separated from populated areas by a larger space than smaller parks.
In order to ensure that the park size is taken into account, we first create a regular grid of fixed size over each park. For this project, cells of 1 hectare (100 square meters) were used, which seemed to provide a good balance between precision and computational speed. Furtheremore, this roughly corresponds to the area of a small-medium sized urban park in Quebec and Montreal.
Instead of considering the centroid of the overall park, we can then consider a multitude of centroids of the cells covering the park. These are the points used to compute the voronoi partition, which is then intersected and area-interpolated with dissemination areas or other census geometries to add the population.
The figure below illustrates the impact of taking a regular grid over the initial park data. This is similar to a rasterization of the vector data.

Given a sufficiently fine grid, the difference between the original park area (right) and the discretized area (left) becomes negligible. Even if the voronoi algorithm scales well with the number of points, this step can become long for very large regions and very fine grids. Regular cells of 1 ha (100 square meters) used in the figure.
As the following lines illustrates, this step is very easy to compute in R:
shpGrid <- sf::st_make_grid(shpParks,
                        c(cellSizeInMeters,cellSizeInMeters)) %>%
  sf::st_as_sf() #create the regular grid

dfGridCentroids <- SfSpHelpers::getCentroids() %>% #helper that adds the centroids as 2 numeric columns lng and lat (NOT a geometry)
  dplyr::select_at( vars( "name","lng","lat")) %>%
  sf::st_set_geometry(NULL)


shpVoronoi <- ggvoronoi::voronoi_polygon(shpGrid,   x="lng",y="lat") #works with dataframes, not sf objects
Canopy dataset obtained from https://www.donneesquebec.ca/recherche/fr/dataset/canopee for Quebec city and http://donnees.ville.montreal.qc.ca/dataset/canopee-2015 for Montreal.↩
This approach is extremely simple, but there are minor technical pitfalls. The polygon shape file are rather larger for both cities (for instance the Val-Belair neighbourhood in Quebec City alone is composed of over 55 000 polygons and one of these if composed of close to 900 000 points) and the polygons themselves can be composed of a few. Simply displaying the entire shp file for all of Quebec city takes a few minutes.↩
Other metrics include the normalized vegetation density index (nvdi), which represents the reflectance of green and can be computed from landsat raster images. Check out my past tweet suggesting that nvdi values are correlated with canopy index. However, nvdi has a tendency to overaccentuate grassland over trees, particularly those with darker foliage.↩
See this other blog post for more details.↩
Strangely enough, the base de plein air Sainte-Foy does not even touch Sainte-Foy. It lies entirely within the Aeroport neighbourhood.↩
An important limitations of this computation is the use of as-the-crow-flies rather than street based distances.↩
This approach explicitely assumes that population density is uniform over a given dissemination area, which is a relatively safe assumption in urban settings.↩
It is important to note the difference in scale for both maps. Since the parks are spread out over a larger region in Montreal, they appear smaller than they really are when comparing with those in Quebec City.↩
This park, which in fact is simply a road divider with trees, has a very rich history. It was initially developped in the 19th century as a fire safeguard between the Saint-Roch and Saint-Sauveur neighbourhoods after a major fire destroyed large swath of the lower part of Quebec City.↩
